
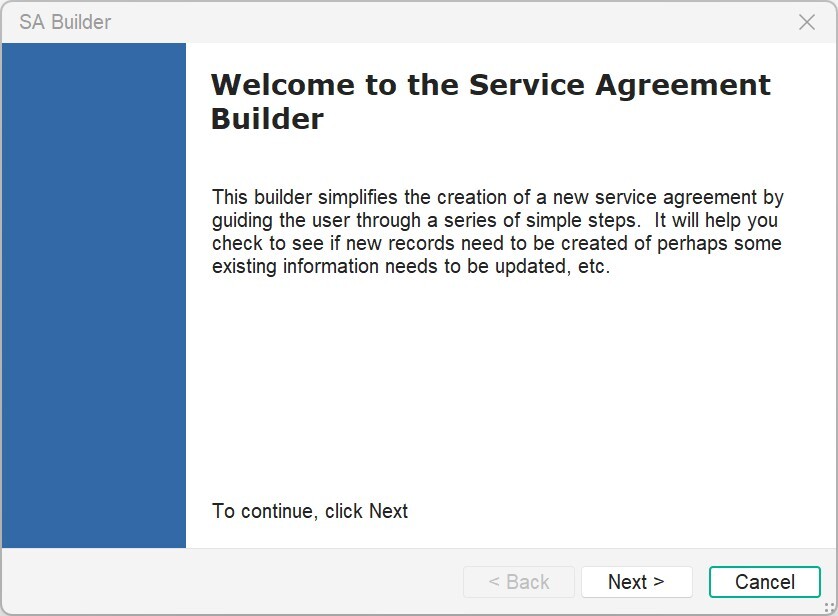
New referrals can be imported from Google or Microsoft Forms.
A new service request is created using a "Wizard" that guides the user through a set of questions, such as "Is this an existing participant?" and changes the entry screens accordingly.
This increases accuracy while reducing the amount of data entry required.
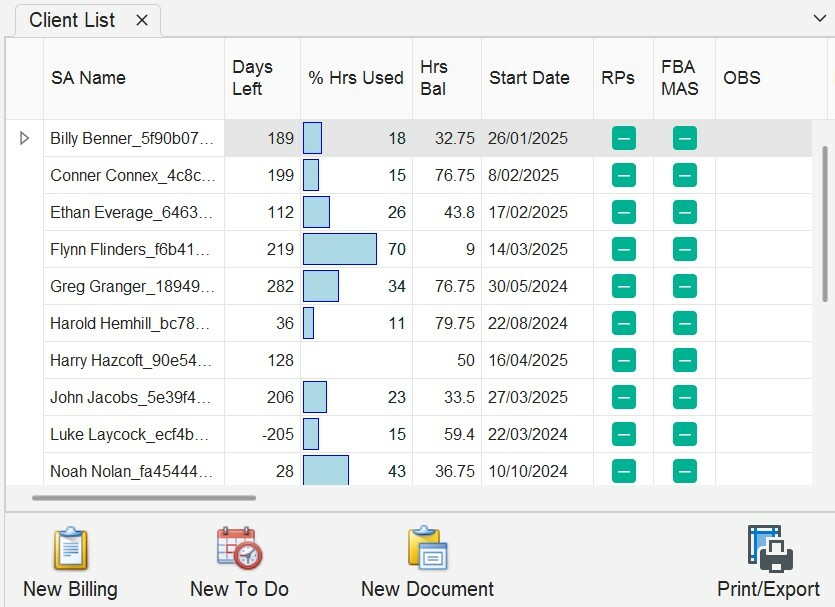
Each practitioner will see a list of their clients/ service requests when they log in.
The list provides a quick visual indicator of the hours used and specific prompts to assist with the service plan.
The practitioner can easily create a new Billing, Document or "To Do" for this client.
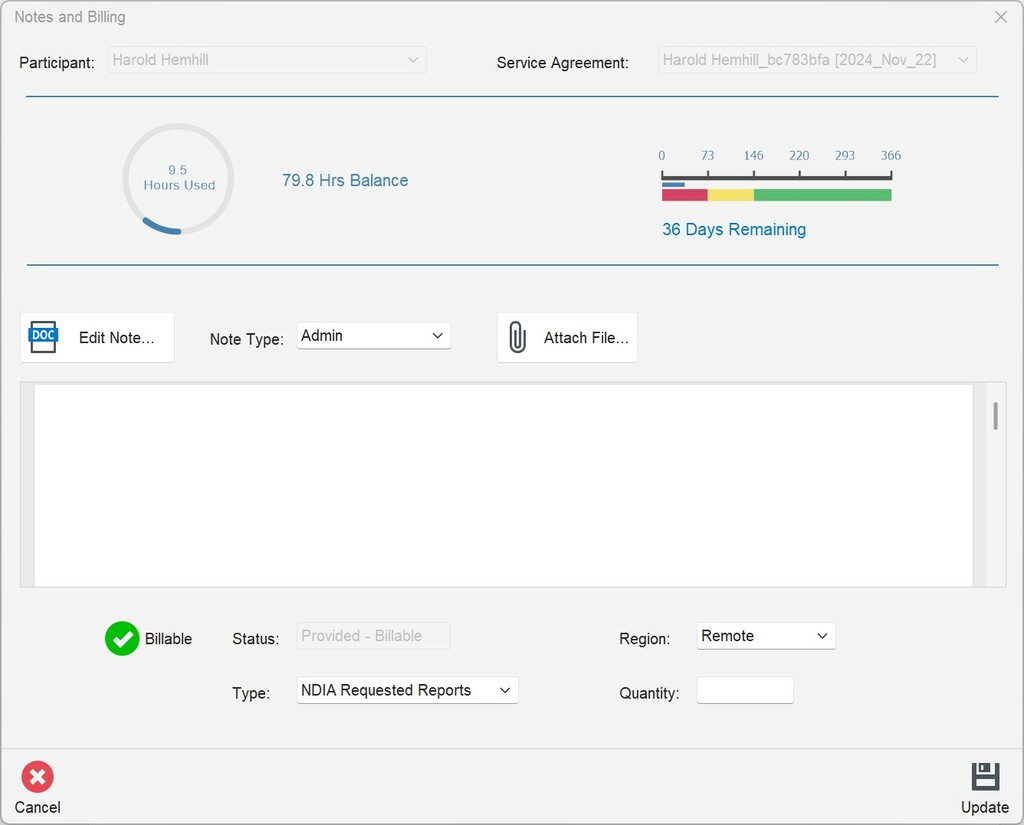
Notes and Billing provides a quick visual indicator of the hours used and the number of days remaining for the service contract.
The practitioner can quickly add new notes and billing information.
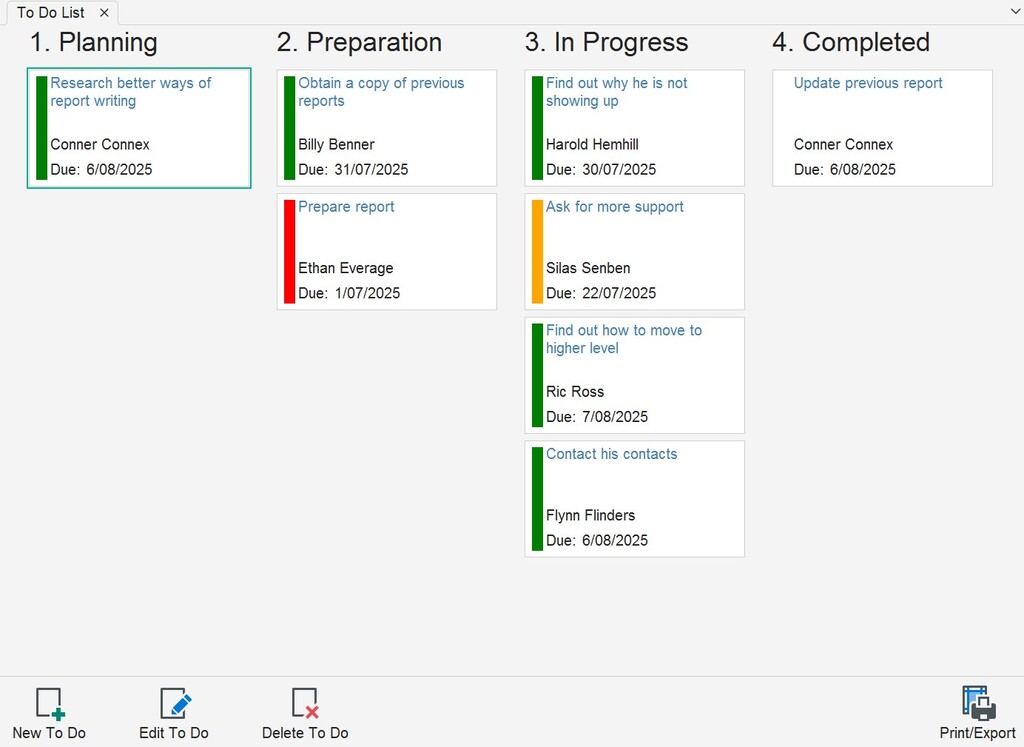
The To Do list is proved as a Kanban board. Items can be dragged from one column to another as a stage is completed.
Visual indicators show if a To Do is due within the next week (amber) or overdue (red).
If an item is overdue the system will automatically send you a reminder message.
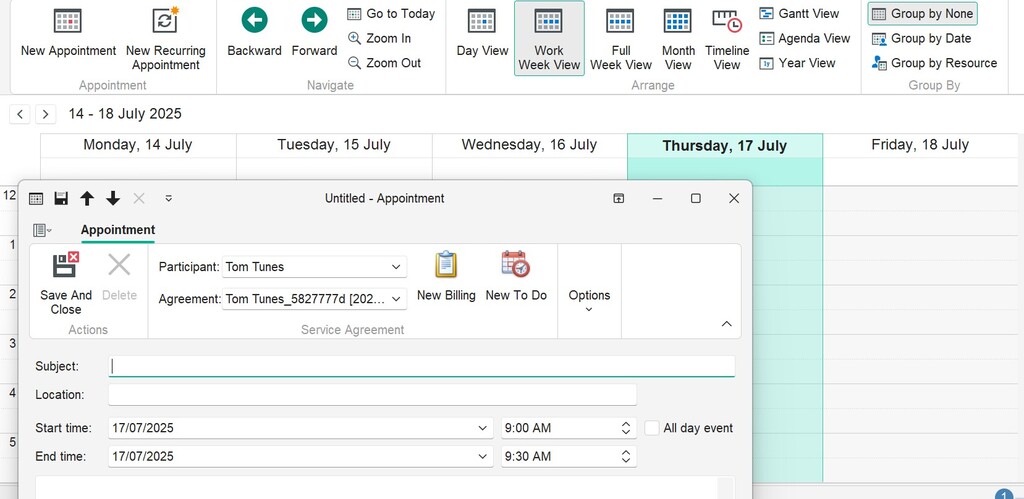
A fully featured calendar is integrated within the application.
A practitioner can add new billings or To Dos from within an appointment.
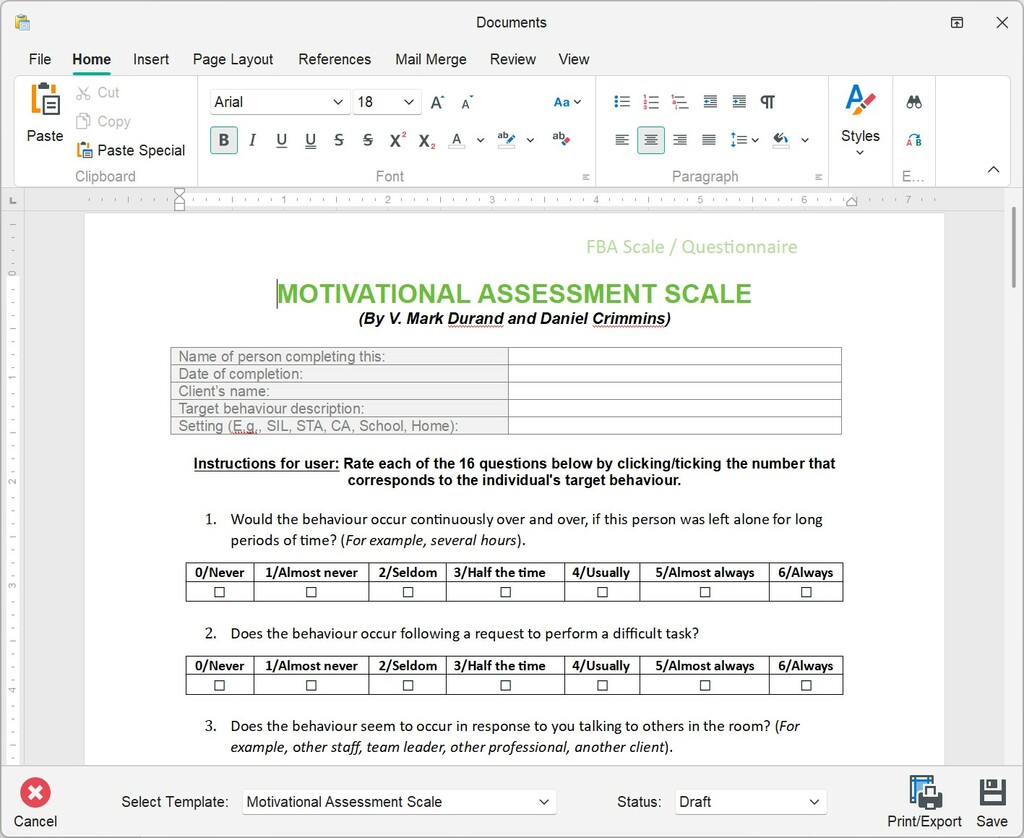
A practitioner can select a new document from a list of templates.
The Word Processor is fully integrated within the application, so everything is in the one place.
Administrators can add and edit the templates as requirements change.
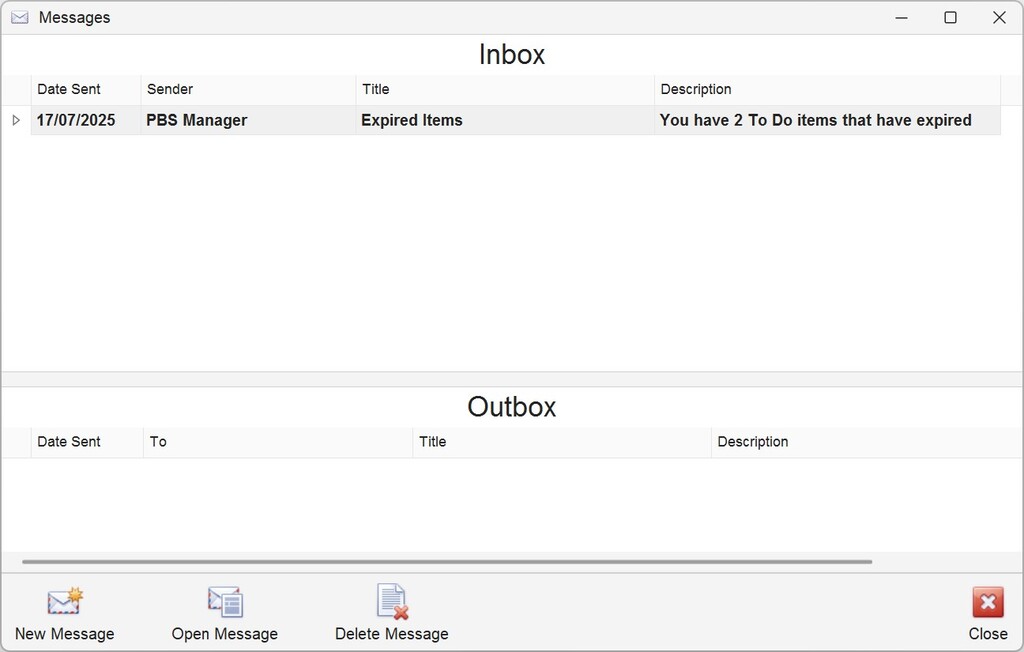
The application will send you a message to let you know that a To Do has expired.
You can also send messages to other users within the system.
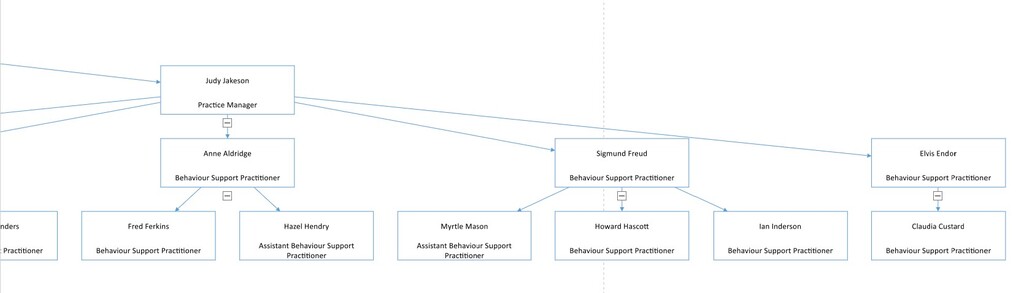
Users can be designated as team leaders, practice managers or assistant practitioners. Each user type has different reports and features available to them.
The built in organisation chart automatically calculates the structure of the organisation according to what you have specified.
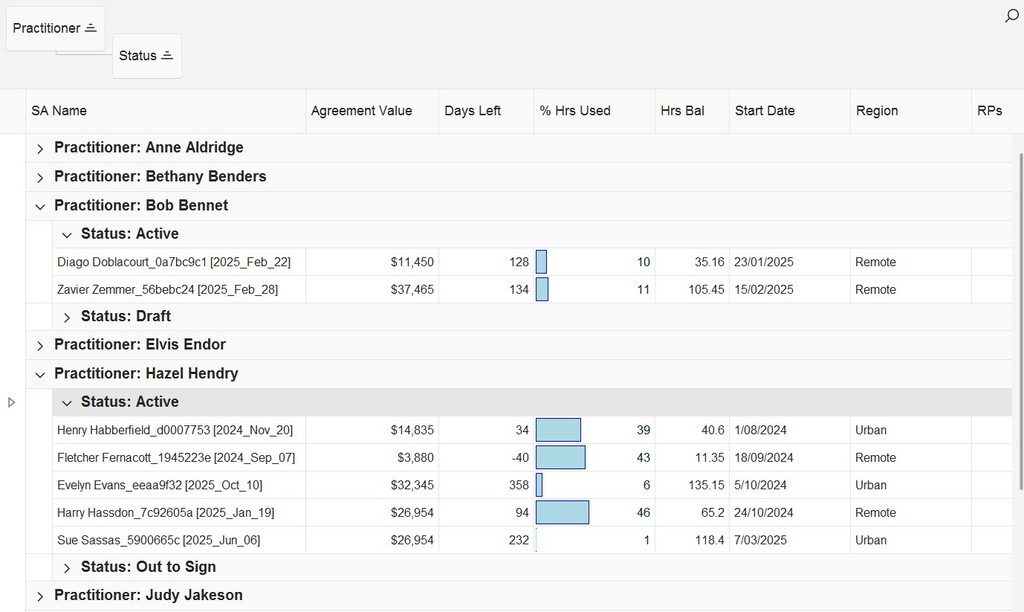
A practice manager can view the client lists of each practitioner.
The list allows items to be grouped using drag and drop e.g. grouping by Practitioner and then by Status, as shown.
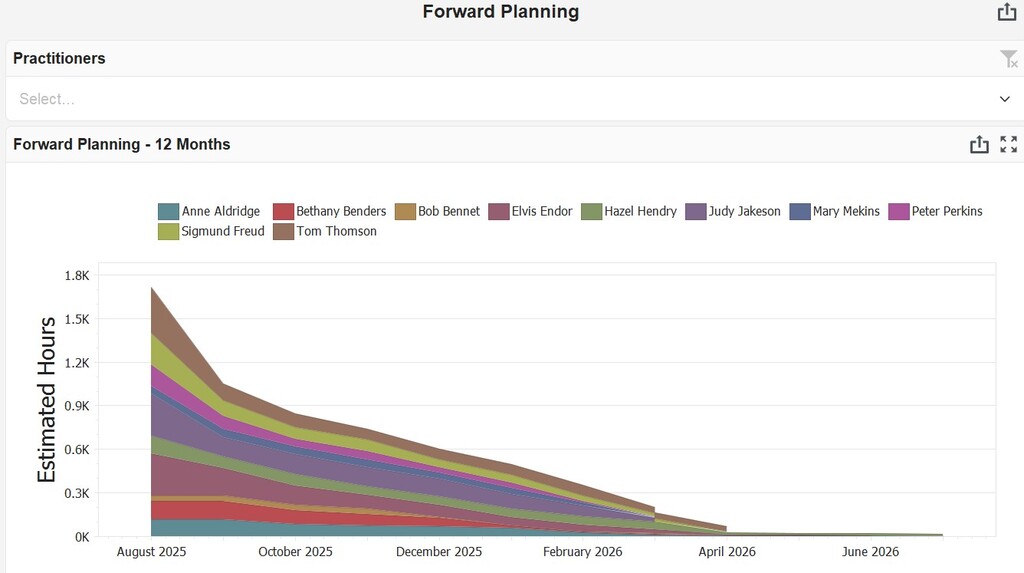
A practice manager can view the estimated future workload for each practitioner.
The dashboard is interactive, so you can see the estimated workload for just one individual, if desired.
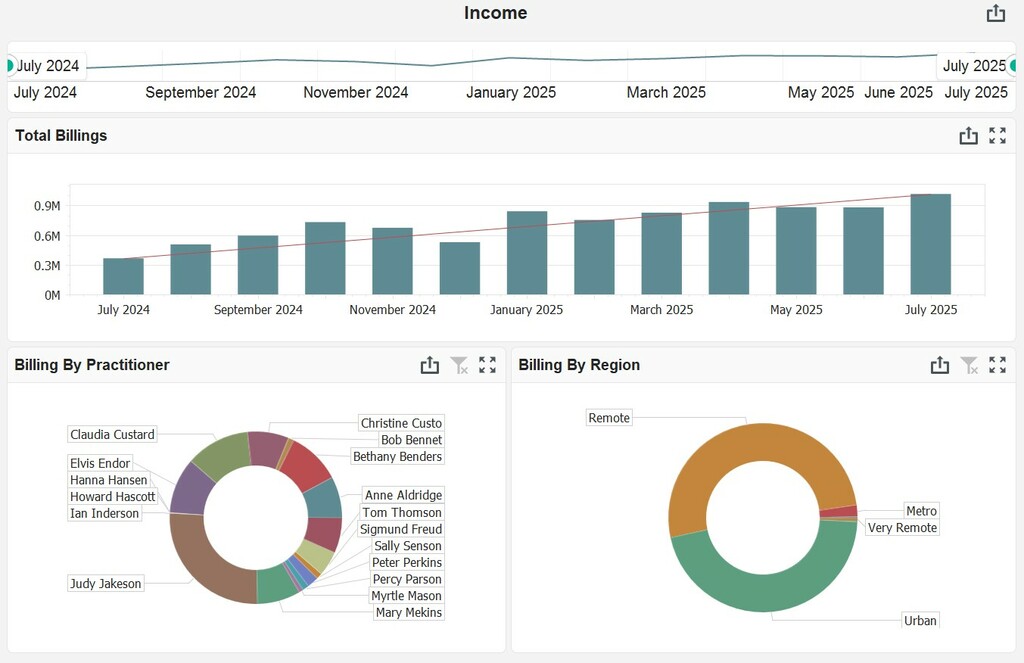
A practice manager can view income in a variety of charts.
The dashboard is interactive, so you can click on just one practitioner or one month etc. and the other charts will be filtered by that selection.
All rights reserved. 2025 Quick Start Software
Creating customised software since 1995