
This is an interactive dashboard. For example, if you click on the red segment of the “Project Health” chart, the other charts and the financial data will change to only include projects with a red project health.
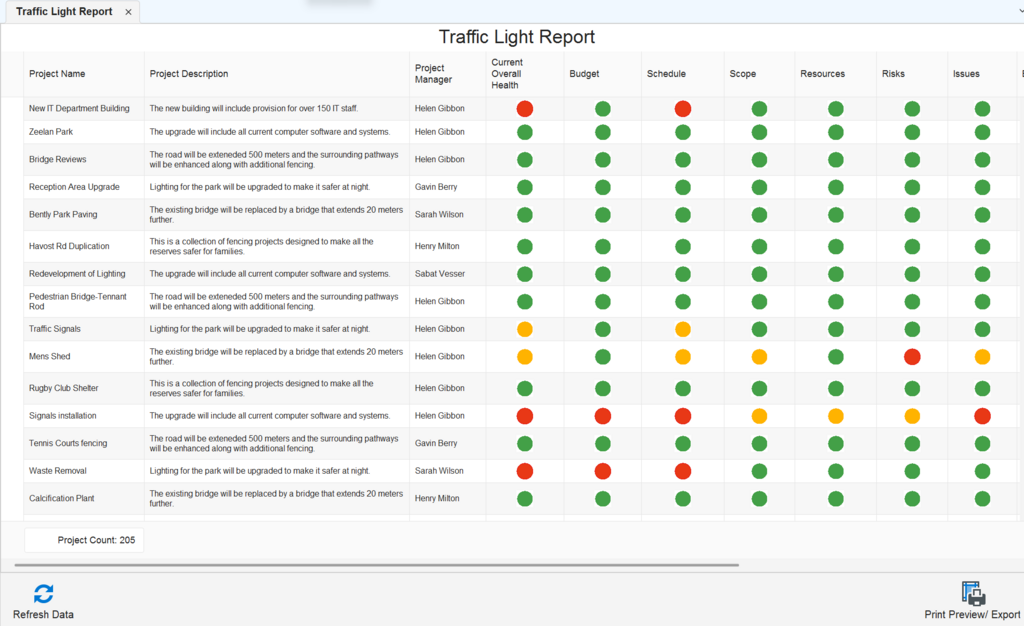
A list of all projects showing various details including project health indicators. You can customise the report by grouping, sorting and/or filtering the list as well as removing unwanted columns.
The project health is contrasted with the lifecycle phase of the project.
This is an interactive dashboard. For example, if you click on the red segment of the “Overall Health” chart, the “Lifecycle Phase” chart and the projects list will change to only include projects with a red project overall health.
Individual charts or the whole dashboard can be printed, or exported to as a PDF, Image file or Excel spreadsheet.
This is an interactive dashboard. For example, if you click on the red segment of the “Schedule” chart, the “Milestones” chart and the “Tasks” chart will change to only include projects with a red schedule health.
Individual charts or the whole dashboard can be printed, or exported to as a PDF, Image file or Excel spreadsheet.
Forecast demand for specific roles for a selected time period.
You can:
- use the filter at the bottom of the screen to select a time period.
- click on a doughnut chart segment to select a role.
- click on a bar in the bar chart to select a project.
This is one of our most popular reports. You can quickly see if someone is over or under allocated and which projects they are allocated to.
This is an interactive dashboard. For example, if you click on the red segment of the “Project Health” chart, the other charts will change to only include projects with a Red overall health.
You can filter the projects by dragging the indicators in the bar filter at the top of the screen. It will then filter the projects according to the budget allocated for the current financial year.
This report combines data for project health (bubble colour), Actuals (bubble size), budget for the current financial year (X axis) and Adjusted Forecast (actuals and forecast) for the current financial year (Y axis).
The project name, lifecycle phase and health are shown when you hover the mouse over a bubble.
You can filter the projects by dragging the indicators in the bar filter at the top of the screen. It will then filter the projects according to the budget allocated for the current financial year.
All rights reserved. 2025 Quick Start Software
Creating customised software since 1995